
Distribution can be a meaningful slice of a packaging system's footprint, yet transport is often modeled with generic, one-size-fits-all assumptions. As freight electrifies and logistics networks are re-optimized, those defaults age quickly, and the difference between a diesel and a battery electric leg is no longer a rounding error.
Here is why transport deserves closer attention, what is new in PIQET, and how to model your own distribution network with confidence.
Why transport modeling matters more than it used to
Trucks and buses make up fewer than 8 percent of road vehicles, but they produce more than 35 percent of direct carbon dioxide emissions from road transport (IEA, 2025). That impact is now shifting.
Electric trucks reached around 9 percent of global truck sales in 2025, with heavy-freight models growing fastest (IEA, 2026). For packaging teams, this means the transport leg of a footprint is becoming both larger in relative terms and far more variable, depending on vehicle and energy choices.
What is new in PIQET
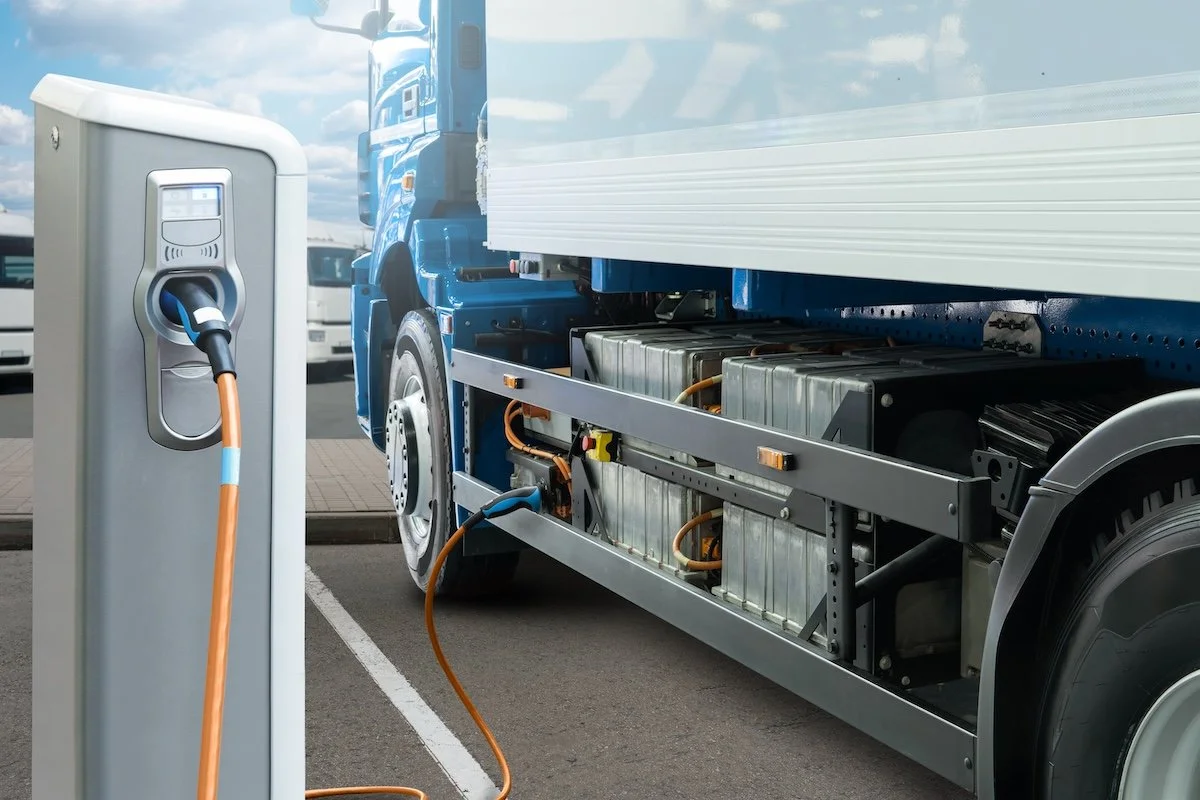
PIQET now includes two battery electric truck processes for distribution modeling:
Battery electric truck (28t), grid electricity, which charges from the regional grid mix.
Battery electric truck (28t), renewable energy, which uses the same underlying vehicle model but assumes charging from 100 percent renewables, based on large-scale solar photovoltaic.
Both use a battery electric commercial truck with an estimated curb weight of 3.5 to 16 t and a gross vehicle weight of 28 t, giving you a like-for-like way to test how the charging source alone changes results.
How the model was built
The processes follow a cradle-to-grave system boundary, covering the truck from manufacturing through to end-of-life disposal to landfill. The vehicle model adapts a conventional diesel distribution truck and adjusts for electric components, including an average battery cell input from lithium-ion LFP and NMC811 with 300 kWh installed capacity, based on a life cycle assessment (LCA) comparing diesel and battery electric distribution vehicles undertaken by Scania (Burul and Algesten, 2021). Electricity consumption is calculated per kilometer from the same study, and charging electricity is regionalized following PIQET's standard data procedure.
We are transparent about the boundaries: battery recycling and replacement are not included in the current model, so results reflect a single battery life. As with all PIQET processes, where you hold better primary data you can refine the assumptions.
Grid versus renewables: why it matters
Because the two processes share the same vehicle and differ only in charging source, they isolate one of the most consequential decisions in electrified logistics: where the electricity comes from. A truck charged on a coal-heavy grid tells a very different climate story from the same truck on renewables. This is exactly the kind of scenario comparison PIQET is designed to make quick and defensible, rather than a one-off manual calculation.
Custom logistics, not just custom trucks
Electrification is only part of the picture. PIQET's transport processes correlate fuel use per kilometer to the freight load carried, using a methodology adjusted to match ecoinvent truck transport data (Houghton and McRobert, 1998). In practice this means heavier or lighter loads, and better-utilized vehicles, are reflected in the result rather than averaged away. Combined with regionalized data and selectable transport modes, you can build a distribution model that reflects your actual network, its distances, loads, and energy sources, instead of relying on a single default leg.
The takeaway
Freight is one of the fastest-moving parts of the supply chain, and transport is no longer a safe place for generic assumptions. Model your real distribution network in PIQET, test electric against diesel and grid against renewables, and see what fleet electrification would mean for your packaging footprint before your logistics provider makes the switch.
FAQs
How is transport modeled in a packaging LCA?
A transport leg is defined by distance, mode, vehicle type, and the load carried. PIQET correlates fuel use per kilometer to freight load, so a better utilized vehicle produces a different result from a part-empty one travelling the same distance.
Does electricity source change the result for an electric truck?
Yes, substantially. PIQET’s two battery electric truck processes share the same vehicle and system boundary and differ only in charging source, so you can isolate that single variable.
What is excluded from the battery electric truck model?
Battery replacement and recycling are not included, so results reflect a single battery life. Where you hold better primary data, you can refine the assumptions.
Interested to understand more about modeling transport in PIQET? Schedule a demo via the link below.
References
Burul, D. and Algesten, D. (2021) Life cycle assessment of distribution vehicles: battery electric vs diesel driven.
Houghton, N. and McRobert, J. (1998) Methodology correlating heavy vehicle fuel use per kilometre to freight load, as implemented in PIQET transport processes.
International Energy Agency (2025) Trucks and buses. Paris: IEA.
International Energy Agency (2026) Global EV Outlook 2026: Trends in heavy-duty electric vehicles. Paris: IEA.
PIQET (2025) PIQET data information sheet: battery electric truck, and PIQET Data Manual v5.1. Lifecycles.